")
")
Editing a Smart Chart / Diagram!
Working with the Smart Chart Diagrams in the iSlide PowerPoint add-in is so good and easy to do, that you never want to use anything else. It even beats a graph made in Microsoft Excel! Select the diagram (chart); find the editing pencil in the right upper corner and start editing the values and colors with the scroll bars or by typing the values. It will never get easier than this! Change the vector, or picture in the chart to match your presentation theme. Adjust the icons with the icon library, and your absolutely perfect chart is ready in a minute. A golden tip? Select the whole chart/diagram and use Ctrl+C (copy) to Ctrl+V (paste) this chart into your Microsoft Word document, Excel sheet, Outlook email, or even into your Teams chat with your colleagues, or even customers. Personalizing the data you want to show or share is one of the major key components in persuasion and connecting with audience, clients and colleagues nowadays!
|
|
|
|

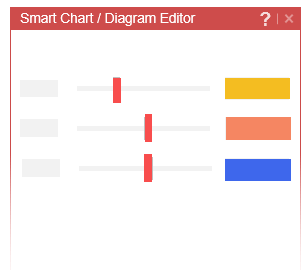 (2) Adjust the values with the scroll bars
 (3) Done, what a great chart you made!
Do you see the benefits of using the iSlide add-in now? There is a free subscription! Try iSlide now!