<h1><strong style="color: #F84D4D;">Smart Charts & Diagrams</strong></h1>
<h4><p>The Smart Diagram Library provides you with a very powerful set of tools to spice up your presentation. We all know that if you visualize data, it becomes much more effective. And yes,.. One picture can be better than a thousand words. Take a look at what the iSlide Smart Diagram can do for you and try it out. It becomes really amazing when you combine the same graphics with different data in a transition style!</p></h4>
<hr/>
<table style="height: 500px; width: 1100px; margin-left: auto; margin-right: auto;">
<tbody>
<tr style="height: 145.302px;">
<td style="width: 369.375px; height: 145.302px;">
<p><br/><span style="font-size: large;"><h2><strong>Make the data visual</strong></h2></span></p>
<p>
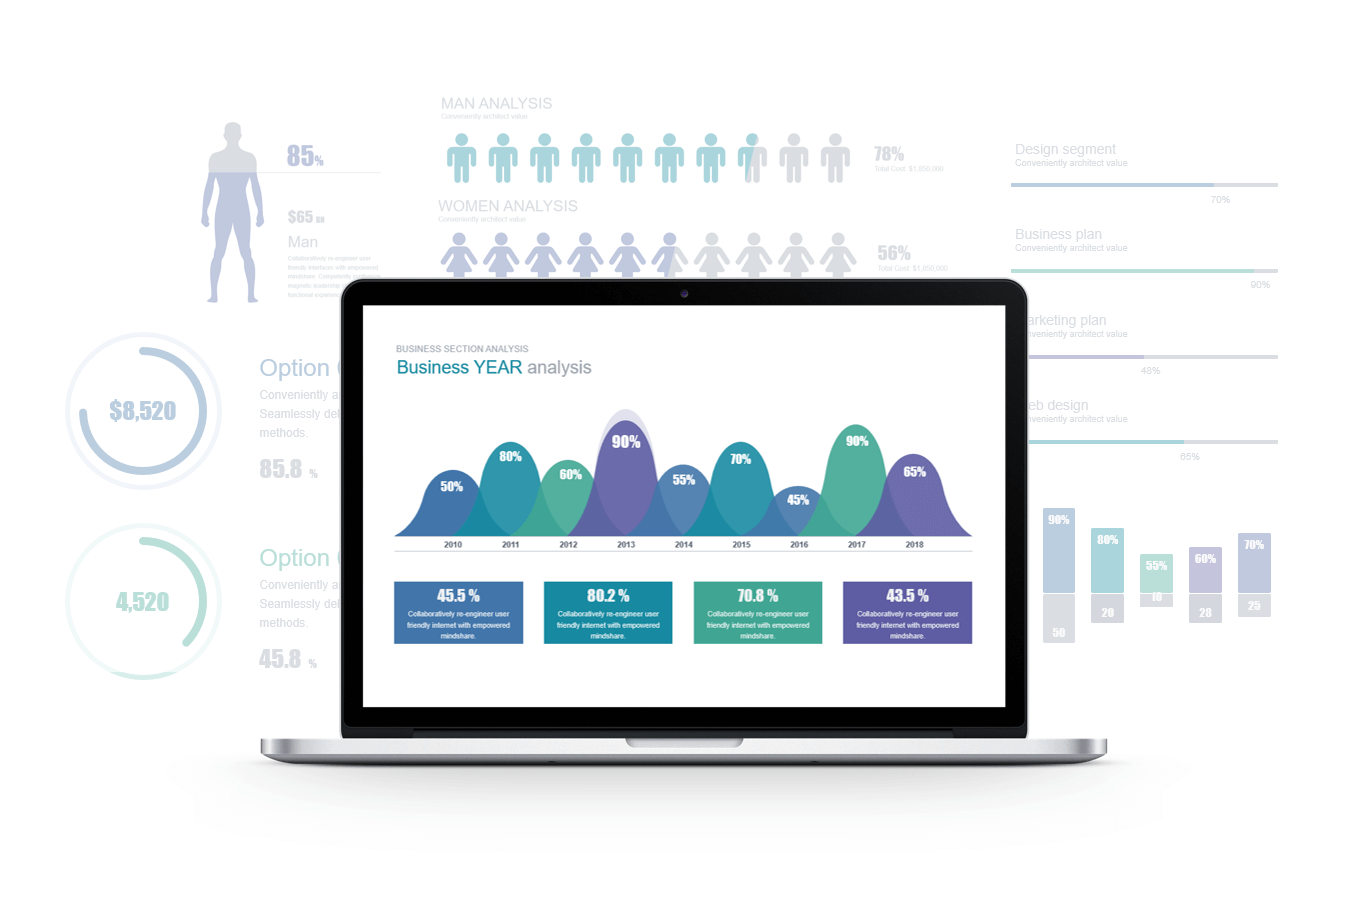
In the Era that "Beauty is the keyword",<br/>we need to "Show" and visualize our data in presentations as much as possible.<br/><br/>Unlike the average mediocre traditional charts,<br/>the iSlide Smart Chart &amp; Diagrams presents the data to your audience in a more intuitive and flexible way.
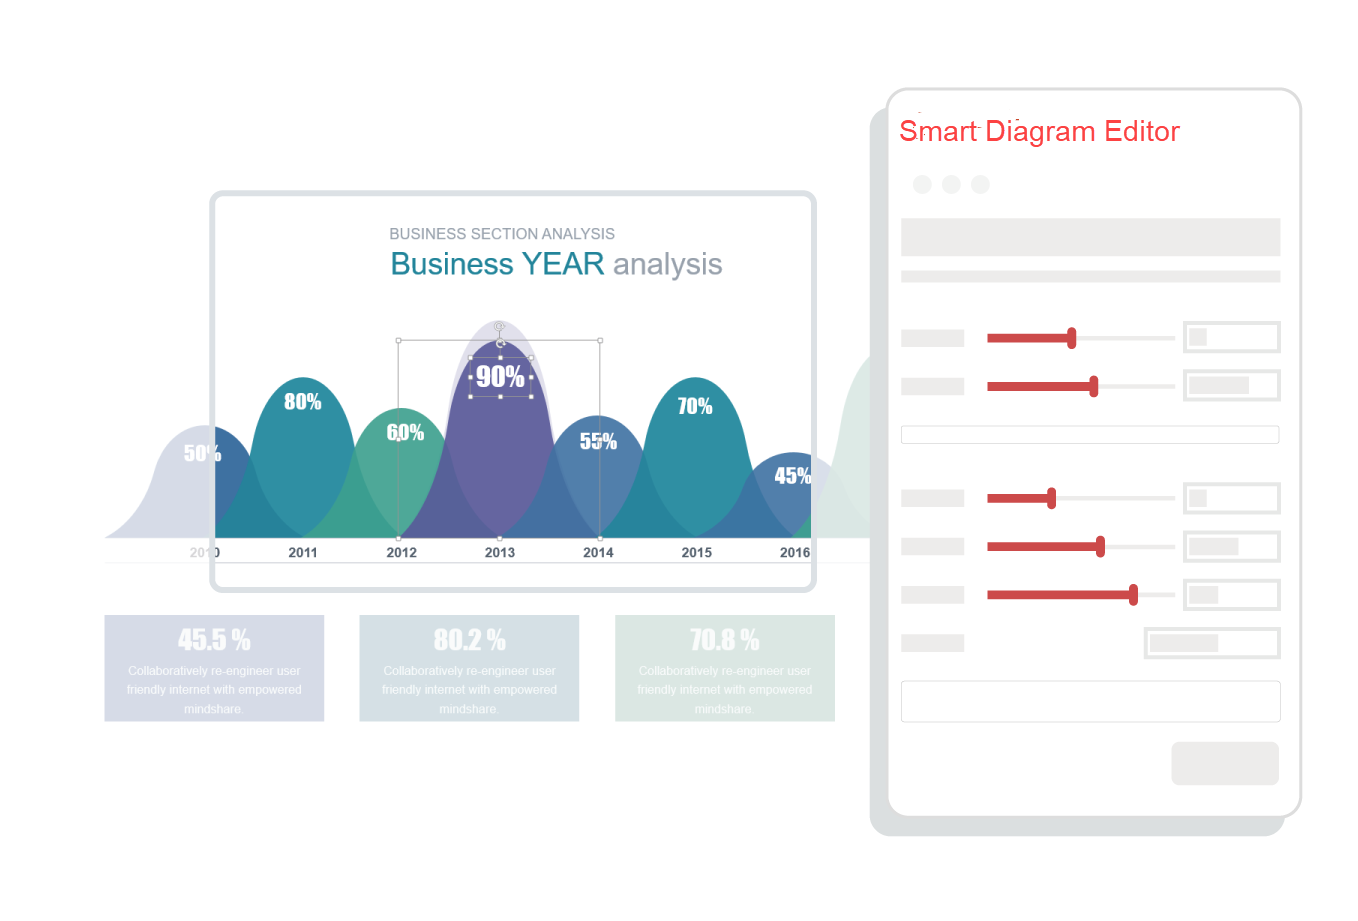
</p>
<p></p>
</td>
<td style="width: 17.1528px; height: 145.302px;"></td>
<td style="width: 703.819px; height: 145.302px;"><img style="float: right;" src="/images/iSlide-Images/Smart-Diagram-1.png" alt="iSlide Smart Diagram picture" width="699" height="474" /></td>
</tr>
</tbody>
</table>
<hr/>
<table style="height: 400px; width: 1100px; margin-left: auto; margin-right: auto;">
<tbody>
<tr style="height: 243.792px;">
<td style="width: 708.08px; height: 243.792px;">
<p><img src="/images/iSlide-Images/Smart-Diagram-2.gif" alt="iSlide Smart Charts with editable icons and colors" width="633" height="373" /></p>
<p></p>
</td>
<td style="width: 355px; height: 243.792px;">
<p><br/><span style="font-size: large;"><h2><strong>Flexible &amp; Editable</strong></h2></span></p>
<p>Boasting the maximum editability, the iSlide Smart Chart feature allows you to change the icons <br/>(112.000+ available) and the data, all on the fly.<br/><br/>Like in the picture here, you can use handy toolbars to change the values for percentages, numbers or colors and the data of the chart will automatically adjust with the value in real-time. Making charts and graphics was never so easy!</p><br/>
<p><u>Tip:</u> Select the chart, and copy/paste it directly into your Word document!</p>
</td>
</tr>
</tbody>
</table>
<hr />
<table style="height: 400px; width: 1100px; margin-left: auto; margin-right: auto;">
<tbody>
<tr style="height: 145.302px;">
<td style="width: 369.375px; height: 145.302px;">
<p><br/><span style="font-size: large;"><h2><strong>An always updating<br/>Smart Chart Library</strong></h2></span></p>
<p>Worrying about the next slide, or if you need an adjustment in half a year? No need for that at all. Our creatively professional design team keeps track of all the mainstream design styles and is accumulating and updating this on a daily basis. All according to the PowerPoint guidelines.<br/><br/>So don't worry, keep presenting!</p>
<p> </p>
</td>
<td style="width: 17.1528px; height: 145.302px;"> </td>
<td style="width: 703.819px; height: 145.302px;"><img style="float: right;" src="/images/iSlide-Images/Smart-Diagram-3.png" alt="iSlide Smart Diagram multiple examples picture" width="699" height="473" /></td>
</tr>
</tbody>
</table>
<hr />
<p style="text-align: center;">A well designed PowerPoint presentation, allows the data to speak for itself.</p>
<p style="text-align: center;"><a title="DOWNLOAD NOW" href="/islide-powerpoint/islide-download-discount-contact-and-legal"><span style="background-color: #F84D4D;"><input class="btn btn-primary" type="submit" value="DOWNLOAD NOW" /></span></a></p>

IT (Cloud) Services